| Protein |
|---|
| DERM |
| FSTL1 |
| IgD |
Classification and cloud computing
PSTAT197A Fall 2026
Dr. Coburn
UCSB
Announcements/reminders
Module 1 template repository uploaded to GitHub organization
- Due Friday, October 30th, 11:59 PM
Today
Brief review: selecting proteins and fitting a classifier
Interpreting the resulting classification accuracy
Guest session: cloud computing setup
Random forests: recap
Last time, we combined predictions from trees using a majority vote.
Each tree uses a bootstrap sample of observations
At each split, consider a random subset of predictors
Combine predictions across many trees
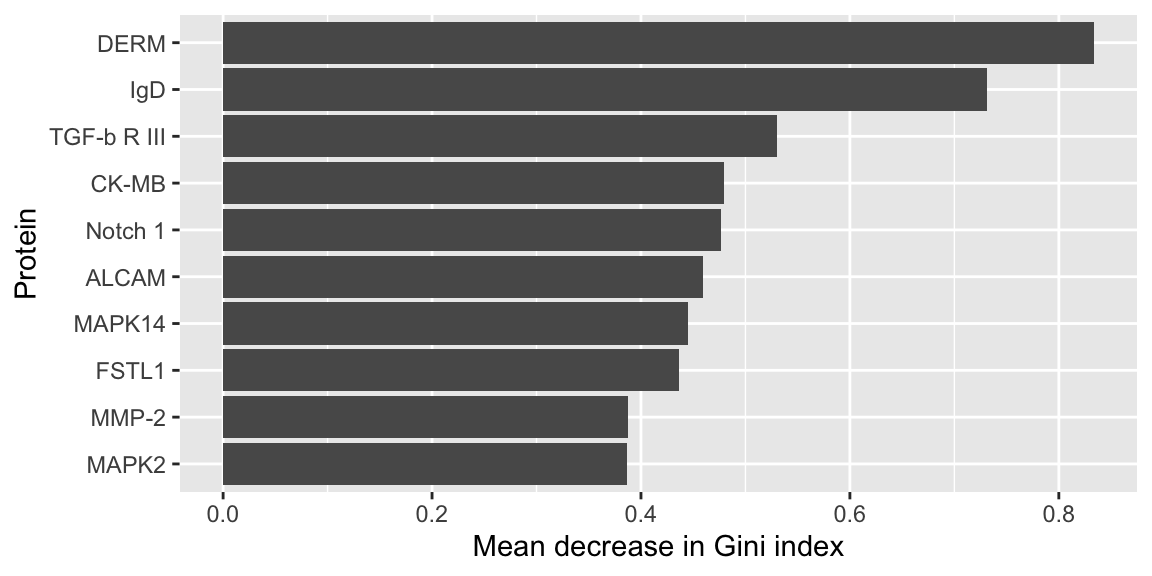
For the biomarker analysis, we also use the forest to rank proteins by variable importance.
Which proteins appear important?
Gini importance summarizes the reduction in node impurity attributed to each predictor across the forest.
Selecting a core panel
For this example, compare the top 10 proteins from:
multiple testing, ranked by adjusted p-value
random forest variable importance
\[ \hat{S}^* = \hat{S}_{\text{testing}} \cap \hat{S}_{\text{forest}} \]
Logistic regression: recap
Let \(Y_i = 1\) indicate ASD and \(Y_i = 0\) indicate TD.
\[ \log\left(\frac{p_i}{1-p_i}\right) = \beta_0 + \beta_1 x_{i1} + \cdots + \beta_p x_{ip} \]
Predictors: proteins in the selected panel
Output: estimated probability of ASD
Classification rule for this example: predict ASD when \(\hat{p}_i > 0.5\)
Fitting the panel model
The modeling function is the same whether we include one protein or several.
Measuring classification accuracy
      Predicted
Actual TD ASD
   TD  57  21
   ASD 17  59
Sensitivity: proportion of ASD observations classified as ASD
Specificity: proportion of TD observations classified as TD
Accuracy: proportion of all observations classified correctly
What do these results tell us?
| .metric | .estimate |
|---|---|
| sensitivity | 0.776 |
| specificity | 0.731 |
| accuracy | 0.753 |
These are training results. We used these observations to select proteins, fit the model, and calculate accuracy.
To evaluate predictions for new subjects, repeat preprocessing and protein selection within the training portion of each split, then evaluate on held-out observations.
Cloud computing
Guest session: setup
Guest lecture material to be added here.
Next time
Cloud computing: hands-on use
Variable selection via regularized estimation
Design assessment of the Hewitson analysis
- Mini assignment: sketch a diagram representing the data analysis in the paper; come prepared to share
Section this week: office hours for setup troubleshooting and questions.

PSTAT197A Fall 2026