| Class Standing | Count | Percent |
|---|---|---|
| Senior | 49 | 89.1 |
| Junior | 5 | 9.1 |
| Junior (senior credits) | 1 | 1.8 |
Sampling concepts and descriptive analysis
PSTAT197A Fall 2026
Dr. Coburn
UCSB
Today
review sampling concepts
introduce class survey data
present descriptive analysis
Sampling concepts
Samples and populations
population: collection of all subjects/units of interest
sample: subjects/units observed in a study
statistical methodology strives to account for the possibility that the sample could have been different in order to make reliable inferences about the population based on knowledge of the sampling mechanism
What if inferences aren’t possible?
Even if inference isn’t possible, data still have value and could be used for:
descriptive analysis of the sample;
hypothesis generation;
developing analysis pipelines.
What about prediction?
Prediction is a separate goal but still a form of generalization.
- samples must reflect a broader population for predictions to be accurate at the population level
- if an analyst can’t expect sample statistics to provide reliable estimates of population quantities, they shouldn’t expect predictions based on the sample to be reliable either
Common problems
Several issues arise very often in practice that compromise or complicate an analyst’s ability to make inferences (or predictions). Among them:
scope of inference from the sample doesn’t match the study population
subjects/units are selected haphazardly or by convenience
researcher conflates sample size with number of observations, i.e., takes lots of measurements on few subjects/units
Helpful questions
The following questions can help make an assessment of the scope of inference:
(protocol) how were subjects/units chosen for measurement and how were measurements collected?
(mechanism) was there any random selection mechanism?
(exclusion) are there any subjects/units that couldn’t possibly have been chosen?
(nonresponse) were any subjects/units selected but not measured?
Class survey data
survey distributed to all students offered enrollment in PSTAT197A fall 2026
\(n = 55\) responses
no random selection
Can the data support inference?
From one of your reading responses:
It can make sense to view these. survey responses as a sample from a larger population but it depends on what you consider the larger population. For example, general UCSB students and students in the data science major would not be appropriate as the population, since the students in this class are not randomly selected from those groupings. It can be argued that the students in this class can be a sample of the stats and data science students who are juniors and seniors at UCSB since that is one of the requirements for entering the capstone series. There still might be some bias though since the students who are selected for the program might have stronger resumes or a better academic record than those who are not selected. Another larger population that this data could fit into is all students who have ever been admitted into the capstone series. For this population, I do think the sample data could be more reliable since everyone in the larger population was qualified enough to get into the program.
Alternative perspectives
The comment points to a few possible ways to view the data:
a census of PSTAT197A enrollees
a convenience sample of…
capstone applicants OR
students qualified for capstones OR
students interested in data science OR
all UCSB students???
Is there a right answer?
Either way – census or convenience sample – excludes inference.
census \(\longrightarrow\) no inference needed
convenience \(\longrightarrow\) no inference possible
So on a practical level, it won’t make much difference for designing an analysis of the survey data.
Descriptive analysis
Any analysis of survey data should be regarded as descriptive in nature:
summary statistics and/or models are not reliable measures of any broader population
results should be interpreted narrowly in terms of the sample at hand
Descriptive analysis
A general approach
Start simple and add complexity gradually.
From simpler to more complex consider questions involving:
- Sample characteristics
- Single-variable summaries
- Multivariate summaries
- Model-based outputs (estimates, predictions, etc.)
Questions of interest
Sample characteristics
- How do respondents describe their gender identity?
Single-variable summaries
Among the students offered a seat in PSTAT197, what fields of study are the students most interested in?
What level of comfort do students interested in data analysis at UCSB have with mathematics?
Questions of interest
Multivariate summaries
- Are students who ranked themselves as strong in statistics, mathematics, and computing more likely or less likely to select an ‘industry’ project as the project type that they want to work on?
Model-based outputs
- Are there distinct groups of students in the class defined by self-assessed proficiencies and/or comfort levels with mathematics, statistics, and programming?
Sample characteristics
Aggregate summaries of all 55 respondents; personal information is not linked to shared records.
| Gender Identity | Count | Percent |
|---|---|---|
| Male | 30 | 54.5 |
| Female | 23 | 41.8 |
| Another self-description | 1 | 1.8 |
| Prefer not to say | 1 | 1.8 |
| Race / Ethnicity | Count | Percent |
|---|---|---|
| Asian | 37 | 67.3 |
| Caucasian | 8 | 14.5 |
| Multiracial | 6 | 10.9 |
| Prefer not to say | 3 | 5.5 |
| American Indian or Alaska Native | 1 | 1.8 |
Columns: consent to share project preferences
Rows: consent to share background and preparation
| Skills consent | Yes | No |
|---|---|---|
| Yes | 49 | 2 |
| No | 0 | 4 |
Majors
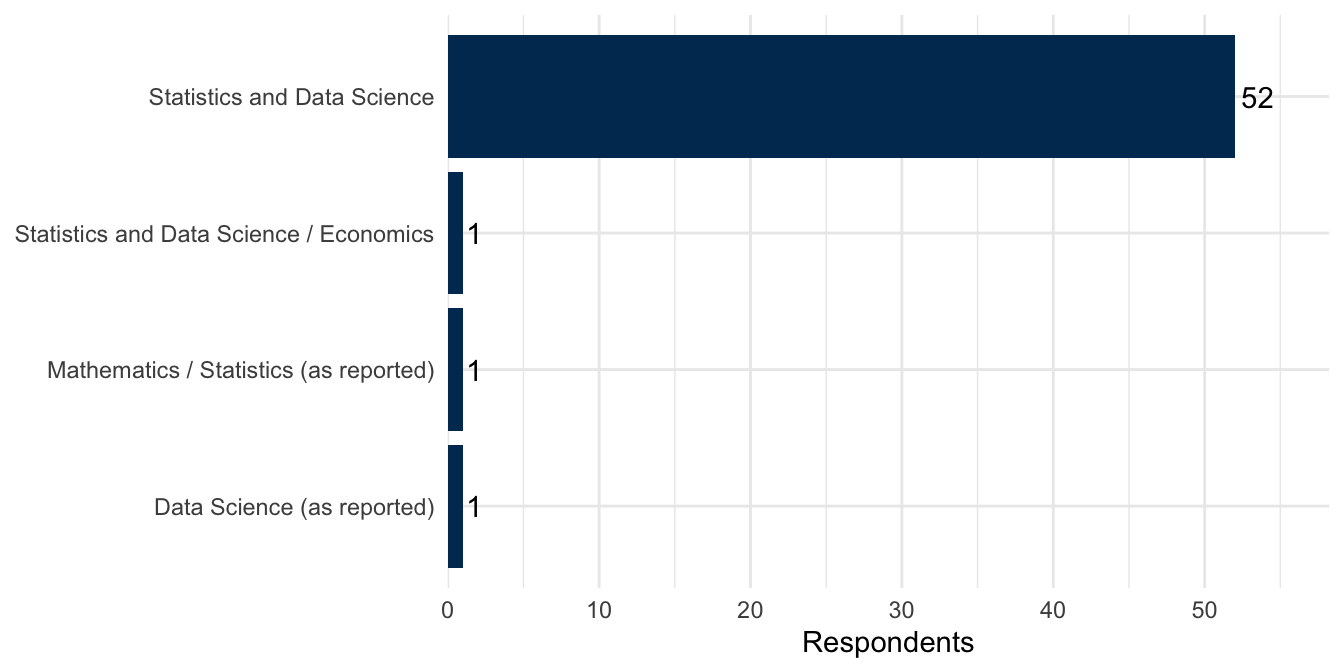
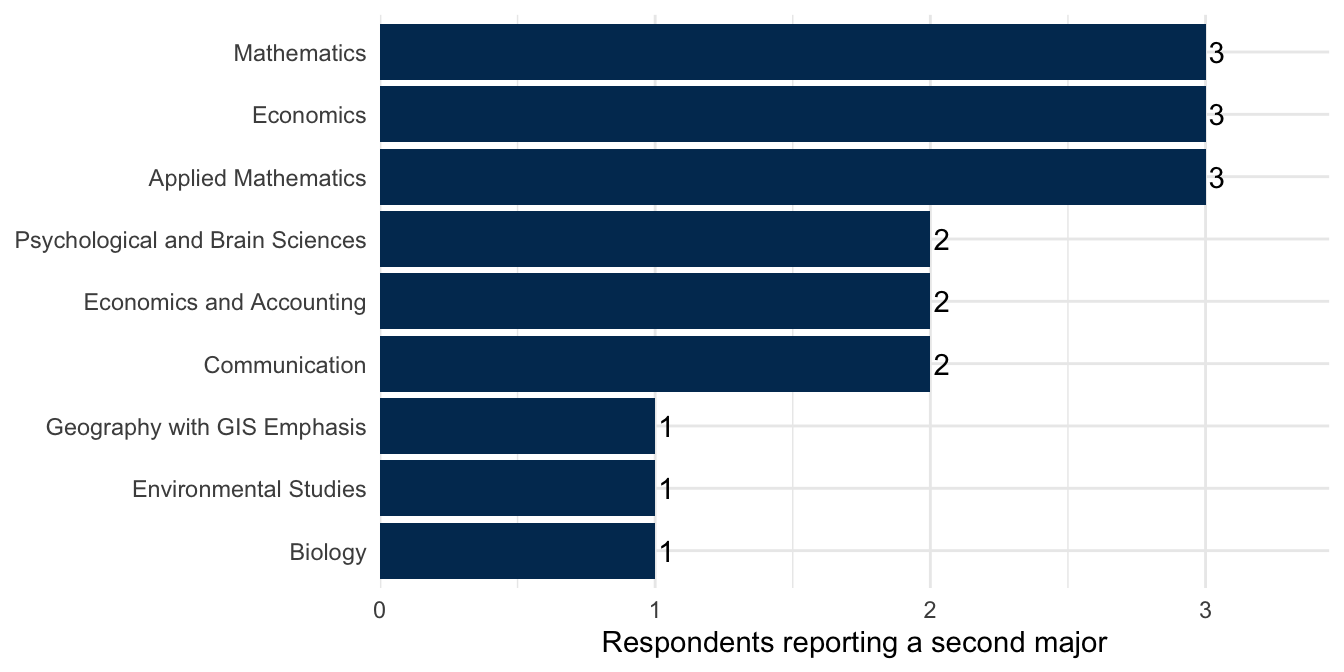
Response timing
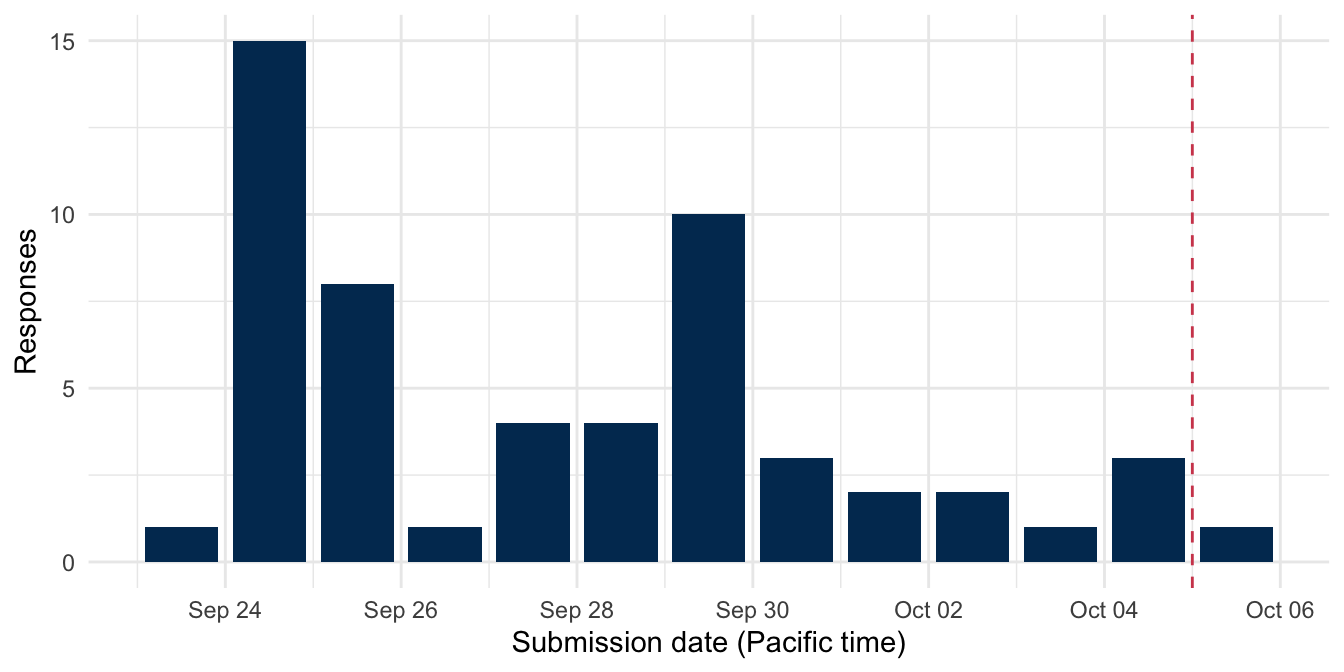
Deadline: October 4, 11:59 p.m. Pacific (dashed line). 54 on time; 1 late.
Shared data
- 51 respondents consented to share skills and experience.
- 49 respondents consented to share project preferences.
- 49 consented to both; use these respondents for joint analyses.
- Consent applies separately to each section. Summaries describe the corresponding subset.
Privacy
The following information has been removed from the dataset distributed to the class:
personal information from section 1 of the survey
long text and free response answers, contain some personal details
each section’s responses when the student did not consent to share that section
individual timestamps; only daily response counts are provided
type distinction between research experiences
Single-variable summaries
What level of comfort do students interested in data analysis at UCSB have with mathematics?
| variable | max | mean | median | min |
|---|---|---|---|---|
| math.comf | 5 | 3.941177 | 4 | 2 |
| prog.comf | 5 | 3.705882 | 4 | 2 |
| stat.comf | 5 | 4.137255 | 4 | 3 |
| variable | mean | median |
|---|---|---|
| prog | 2.68 | 3 |
| math | 3.00 | 3 |
| stat | 3.00 | 3 |
| level | math | prog | stat |
|---|---|---|---|
| beg | 0 | 3 | 0 |
| int | 30 | 32 | 18 |
| adv | 21 | 16 | 33 |
Multivariable summaries
Are students who ranked themselves as strong in statistics, mathematics, and computing more likely or less likely to select an ‘industry’ project as the project type that they want to work on?
Proficiency: beginner = 1, intermediate = 2, advanced = 3. Fixed score intervals keep tied scores together.
| mean.proficiency.fac | both | ind | lab |
|---|---|---|---|
| 1.00–2.00 | 3 | 7 | 1 |
| >2.00–2.50 | 4 | 13 | 1 |
| >2.50–3.00 | 4 | 12 | 4 |
| mean.proficiency.fac | both | ind | lab | n |
|---|---|---|---|---|
| 1.00–2.00 | 0.273 | 0.636 | 0.091 | 11 |
| >2.00–2.50 | 0.222 | 0.722 | 0.056 | 18 |
| >2.50–3.00 | 0.200 | 0.600 | 0.200 | 20 |
Combinations
Consider the distinct combinations of comfort and proficiency ratings (separately):
| prog | math | stat | n |
|---|---|---|---|
| 1 | 2 | 2 | 2 |
| 1 | 2 | 3 | 1 |
| 2 | 2 | 2 | 10 |
| 2 | 2 | 3 | 12 |
| 2 | 3 | 2 | 3 |
| 2 | 3 | 3 | 7 |
| 3 | 2 | 2 | 3 |
| 3 | 2 | 3 | 2 |
| 3 | 3 | 3 | 11 |
| prog | math | stat | n |
|---|---|---|---|
| 2 | 3 | 4 | 1 |
| 3 | 2 | 3 | 1 |
| 3 | 2 | 4 | 1 |
| 3 | 3 | 3 | 4 |
| 3 | 3 | 4 | 2 |
| 3 | 4 | 3 | 1 |
| 3 | 4 | 4 | 8 |
| 3 | 5 | 4 | 3 |
| 3 | 5 | 5 | 1 |
| 4 | 2 | 4 | 1 |
| 4 | 3 | 3 | 1 |
| 4 | 3 | 5 | 1 |
| 4 | 4 | 3 | 2 |
| 4 | 4 | 4 | 4 |
| 4 | 4 | 5 | 4 |
| 4 | 5 | 4 | 4 |
| 4 | 5 | 5 | 4 |
| 5 | 2 | 4 | 1 |
| 5 | 4 | 4 | 1 |
| 5 | 4 | 5 | 4 |
| 5 | 5 | 5 | 2 |
Clustering
Can students be grouped based on combinations of preferences and comfort levels?
| prog.prof | math.prof | stat.prof | prog.comf | math.comf | stat.comf | size | cluster |
|---|---|---|---|---|---|---|---|
| 2.059 | 2.529 | 2.588 | 3.235 | 4.294 | 3.882 | 17 | 1 |
| 1.846 | 2.077 | 2.385 | 3.308 | 2.692 | 3.615 | 13 | 2 |
| 2.667 | 2.524 | 2.857 | 4.333 | 4.429 | 4.667 | 21 | 3 |
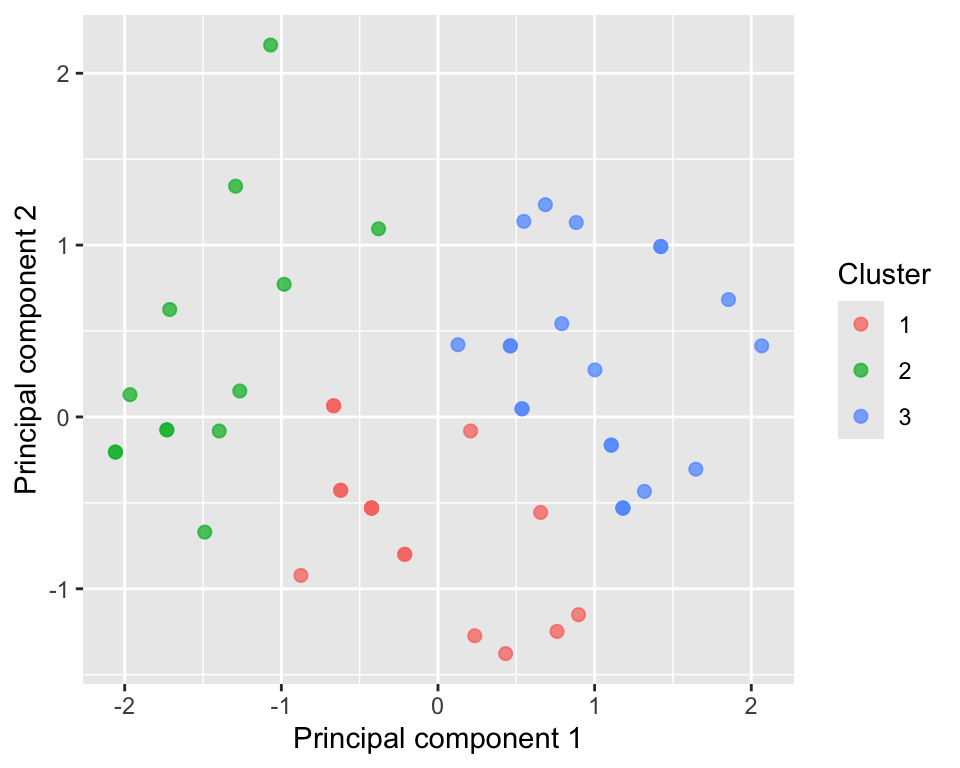
Clustering method, “k means”, groups data by nearest Euclidean distance to each of \(k\) centers. \(k\) is user-specified; the method finds the centers that minimize within-cluster variance.
Cluster labels depend on this year’s fitted centers. The summaries below update with the data.
Cluster 1 (n = 17): mean proficiency 2.39; mean comfort 3.80.
Cluster 2 (n = 13): mean proficiency 2.10; mean comfort 3.21.
Cluster 3 (n = 21): mean proficiency 2.68; mean comfort 4.48.
Proficiency uses scores 1–3; comfort uses the observed numeric ratings. K-means uses unscaled variables, so their scales affect the result. The clusters are descriptive.
Assignment
Your task is to extend this analysis with your group by the assigned deadline.
Here are some ideas:
explore variable associations further (e.g., coursework and self-evaluations)
experiment with clustering on different variable subsets or using different methods
summarize domain or area of interest variables (requires some text manipulation)
Next time
Most of next meeting we’ll devote to planning your group’s task.
Do a little brainstorming on your own
Come with a few questions/ideas

PSTAT197A Fall 2026